Saving Content Feels Productive. Learning Metrics Shows You Whether It Actually Is.
There's a specific kind of busy feeling that comes from saving a lot of content. Tabs closed. Items filed. Library growing. It registers as progress.
But progress toward what? How much of what you saved have you actually learned from? How efficiently are you converting your inputs into outputs?
Most read-later tools have no answer to these questions. Learning Metrics does.
The problem with measuring by saves
Saving is easy to measure — it's a discrete action. Learning is harder. It doesn't produce a click, a notification, or a file.
So most tools measure what they can:
- Items saved: ✓
- Items marked as "read": sometimes ✓
- What you actually understood and retained: not tracked at all
The result is a library that keeps growing without telling you anything honest about whether the time you've spent has produced real knowledge. You feel productive because you're saving. Whether you're learning is invisible.
What Learning Metrics does
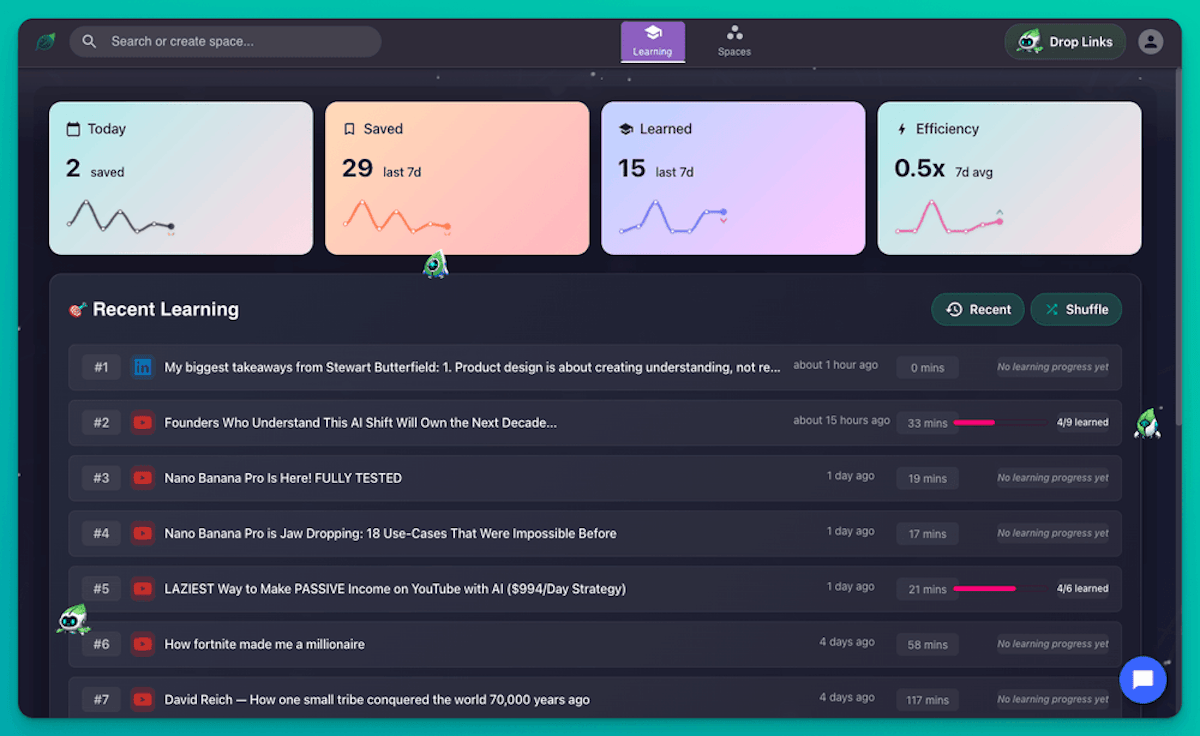
Learning Metrics gives you four specific, honest numbers about your learning activity — no inflation, no inference:
Today — how many learning actions you've taken today. A daily pulse check.
Saved — how many items you've saved in the selected time period. Your input.
Learned — how many insights you've explicitly marked as learned across your saved content. Your output. You control this by checking off insights in Highlight Cards.
Efficiency — the ratio of time spent learning vs. time spent saving. A high number means your learning sessions are productive relative to your saving activity. A low number is a signal: slow down on saving and spend more time with what you've already got.
All four metrics include trend lines and a time period selector — 7 days, 30 days, or longer — so you can see whether your activity is growing, plateauing, or drifting.
How to read your metrics
- Navigate to Learning Metrics from your dashboard
- Review your four metric cards
- Compare Saved vs. Learned — the gap is your active backlog
- Check Efficiency — if it's declining, you're saving faster than you're learning
- Mark insights as learned in Highlight Cards to move your numbers
The gap between Saved and Learned is the most informative number in the whole dashboard. It tells you how much knowledge you've stored that hasn't been converted into anything yet.
Learning Metrics alongside Highlight Cards and Focus Mode
Highlight Cards is where your Learned count actually moves. Every insight you check off in the Highlights view adds to your Learned total. Learning Metrics shows you the aggregate; Highlight Cards is where the work happens.
Focus Mode is how you close the gap efficiently. Setting a topic and working through your queue in a structured session produces more Learned movement per hour than open-ended browsing.
If your Efficiency is low, the fix is usually more Focus sessions and fewer new saves — not saving smarter, but learning from what you already have.
Who uses Learning Metrics
Knowledge workers who need to know whether their learning investment is paying off — not as a gut feeling, but as actual numbers. Learning Metrics makes the answer concrete.
Lifelong learners building expertise over time. The trend lines show whether consistency is building or whether learning has drifted back into passive saving.
Students and researchers who want to track progress through a specific body of content. A Saved count of 40 and a Learned count of 5 tells you something clear: you have a lot of material you haven't engaged with yet.
Frequently Asked Questions
How does SaveForLater.ai know what I've "learned"? It doesn't guess. You mark it. When you check off an insight in the Highlights tab of any saved item, that counts as one Learned unit. Learning Metrics is accurate because it reflects what you explicitly told it — not an algorithm's inference.
What counts as one "Learned" item? One insight checked off in Highlight Cards. A single piece of content might have 10, 20, or 30 insights — each one is an individual data point in your Learned count.
What does Efficiency actually measure? The ratio of learning activity to saving activity in your selected time period. Higher means more time spent on the learning side. It's a directional metric — use it to spot drift, not to optimize to a specific number.
What if I want to mark everything as learned without checking individually? In the Highlights tab for any content item, there's a Toggle all learned option to mark every insight at once. Use it when you've fully worked through the content.
Can I see metrics for a specific Space or topic? Currently, Learning Metrics is across your full library. Time period filtering is available; Space-level filtering is not yet supported.
Is there a "good" Efficiency score to aim for? No fixed target — it depends on your phase. When building a new research area, you'll naturally save more than you learn. As a topic matures, Efficiency should climb. The trend matters more than any single number.
The bottom line
Saving is not learning. Knowing the difference — with actual numbers, not a feeling — is what separates people who build real expertise from people who build impressive libraries.
The gap between your Saved and your Learned is your honest to-do list. Learning Metrics puts it in front of you.
See your learning numbers in SaveForLater.ai →
Related: Highlight Cards · Focus Mode · Mastery Plan